Problems with automated account creation have been fixed by a server restart.
Monday, December 12, 2011
Wednesday, November 30, 2011
QuakeSim Jira
We have started using Jira to track tasks and bugs. See http://grids.ucs.indiana.edu:8080/jira/ for more information. Bugs can be reported and issues can be browsed anonymously. You can also create an account if you would like additional feedback.
Tuesday, September 13, 2011
Simplex and Disloc User Interface Updates
We have made several updates to Disloc and Simplex:
- The Simplex and Disloc portal interfaces now handle linked changes in fault parameters. For example, changing a project fault's latitude and longitude values will automatically update other connected parameters such as the length and strike.
- Simplex now includes a "quick add" feature that allows you to paste in values for the faults and project origin. This is useful if you have a legacy Simplex problem and only know the Cartesian values for the faults.
- Simplex now allows you to change your project temperature, number of iterations, and origin after the project has been created. This will also correctly update any project faults. Updates to observations are not currently supported, however.
Monday, July 4, 2011
Daily RDAHMM upgraded to use Google map API v3
The daily RDAHMM web interfaces have been upgraded to use Google map API v3. A "QuakeSim" logo is also added to the bottom right corner of the map.
Friday, July 1, 2011
Simplex, Disloc Archived Data list delete bug fixed
The bug preventing archived results from being deleted has been fixed.
Monday, June 20, 2011
Updates to Simplex
Simplex, QuakeSim's deformation inversion tool, can take several minutes to run so we have added an email notification feature. Before you submit your job, provide an email address, and the portal will send you an email when Simplex completes.
Except for input files, your archived job data links for running jobs will be empty until the job finishes, so wait for the email before clicking.
Sunday, June 19, 2011
Updates to daily RDAHMM web interface
We did several updates to the daily RDAHMM web interface:
1. We combined the two portlet pages into one page, and the four separate pages into one other page. So now whenever we make some general changes to the web interface, we only need to modify the codes of 2 pages, compared with 6 pages previously.
2. The time series plots are not shown in the pop-up windows of the station markers now. A "View Time Series" button is added to the pop-up window, and when the user clicks it, the plots will be shown in a separate window. The size of the plotting component is set to cover the whole window so you can change its size by drag the window.
3. We include displacement data to the UNVACO results so the plots for UNVACO PBO and UNAVCO Nucleus now have two vertical axis - the left one shows the displacements and the right one shows the absolute value. The left and right axis of all plots are now lined up so all the line charts have the same length.
4. A station search function is added to both the portlets and the separate pages. In the portlets, when the user selects a different station in the drop-down list of station IDs, the corresponding pop-up window will open in the map so that the user can see where the station is. In the separate pages, a drop-down list of station IDs and a "Find Station" button is added under the "Get KML" button. The user can find a station by first choosing its ID from the drop-down list and then click "Find Station".
Daily RDAHMM service updated to include displacement data
We have modified the daily RDAHMM service including the unavcotrans.py script to generate displacements data in NEU relative to a reference point for UNAVCO Nucleus and UNAVCO PBO stations.
We also removed some codes for generating a redundant copy of the XML result file.
We also removed some codes for generating a redundant copy of the XML result file.
Wednesday, May 25, 2011
UCERF Version 2.4 Faults Available for Deformation Tools
UCERF 2.4 faults can now be imported into project using the forward and inverse deformation tools (Disloc and Simplex). All version 2 UCERF faults are available through the QuakeTables database.
Friday, May 13, 2011
Two updates to daily RDAHMM
1. We combined the static and dynamic state change number vs. time plot in the daily RDAHMM portlets and separate pages. Users can now get the plot for a bounded area shown with the dygraph component.
2. We changed the function of KML generation so that now it can generate a KML for more than 2 years without causing an OutOfMemory error. It also includes a QuakeSim logo in the generated KMZ. Getting a KMZ for a period longer than 2 years is not encouraged, though, because it will contain too much information for Google Earth to efficiently handle.
2. We changed the function of KML generation so that now it can generate a KML for more than 2 years without causing an OutOfMemory error. It also includes a QuakeSim logo in the generated KMZ. Getting a KMZ for a period longer than 2 years is not encouraged, though, because it will contain too much information for Google Earth to efficiently handle.
Tuesday, May 10, 2011
Updates to Disloc
The Disloc user interface has been significantly revised to make it easier to use. These changes also keep it in sync with the anonymous version available from quakesim.org
.
.
Friday, May 6, 2011
Updated Layouts
We have updated tool layouts. The tab "Deformation Analysis" has been retitled "Deprecated Tools" and moved further to the right. The tab "Revised Deformation Analysis" is now "Deformation Analysis Tools".
Tuesday, May 3, 2011
Separate web pages added for daily RDAHMM
We created separate .jsp pages for daily RDAHMM, which can be directly accessed without going to the QuakeSim computational portal:
http://gf4.ucs.indiana.edu:8080/DailyRDAHMM-portlet/DailyRdahmm_sopac_sep.jsp (for SOPAC GLOBK data)
http://gf4.ucs.indiana.edu:8080/DailyRDAHMM-portlet/DailyRdahmm_jpl_sep.jsp (for JPL GIPSY data)
http://gf4.ucs.indiana.edu:8080/DailyRDAHMM-portlet/DailyRdahmm_unavcoNucleus_sep.jsp (for UNAVCO Nucleus data)
http://gf4.ucs.indiana.edu:8080/DailyRDAHMM-portlet/DailyRdahmm_unavcoPbo_sep.jsp (for UNAVCO Pbo data)
These pages are embed into iframes of the QuakeSim public portal at http://quakesim.org/portal/timeseries. The pages are almost the same as the portlet pages except for two modifications:
1. we removed the section for showing a station's detailed analysis results from the right side of the page, and added a tab to the pop-up window of a station's marker to show these results;
2. we adjusted their sizes so that they fit well into the iframes.
We also created a "small" version of the separate page for JPL GIPSY data at http://gf4.ucs.indiana.edu:8080/DailyRDAHMM-portlet/DailyRdahmmJplSmall.jsp, and this page is embed in the "Station Monitor" tab of the public portal at http://quakesim.org/home.
"Today" button in daily RDAHMM portlet changed
We changed the text of the "Today" button in the daily RDAHMM portlet pages to "Latest", and modified its functionality so that clicking the button now sets the selected date to the latest date when data is available for any station, instead of "today".
Another minor change to the daily RDAHMM portlets is that we modified the layout of the gridsphere portal so that the portlet for JPL instead of SOPAC is shown by default.
Another minor change to the daily RDAHMM portlets is that we modified the layout of the gridsphere portal so that the portlet for JPL instead of SOPAC is shown by default.
Monday, May 2, 2011
pages and services added for Japan data analysis
We added web pages and services to facilitate the RDAHMM analysis to the GEONET RINEX GPS data provided by the Geospatial Information Authority (GSI) of Japan. The overall structure and the interfaces are similar to daily RDAHMM, and the most significant difference is that the GEONET data are collected every 30 minutes, so the pages and services are both tuned to accommodate this type of interval. The pages are here:
http://gf4.ucs.indiana.edu:8080/AriaRDAHMMTest/AriaRdahmm.jsp (for data in LLH)
http://gf13.ucs.indiana.edu/AriaRDAHMMEst/AriaRdahmmEst.jsp (for data in NEU)
http://gf13.ucs.indiana.edu/AriaRDAHMMEst/AriaRdahmmEstMar26.jsp (for data in NEU dated up to Mar 26th).
The third page shows data picked out from an original data set that was collected at a rate of 30 seconds. I.e., the original data were timestamped with "00:00:00, 00:00:30, 00:01:00, ...", and only data timestamped with "00:00:00, 00:30:00, 01:00:00, ..." are picked out and then processed by RDAHMM and presented in the web pages.
RDAHMM executale and evaluation process updated
We updated the RDAHMM executable to correct two bugs: one that makes the binary to generate the same .maxval and .minval files when building models and the other that could lead to "0"s in the state sequence files because of overflow.
We also updated the evaluation process so that if "0"s are seen in the resulted .Q file, we rerun the evaluation step with an extra "-addstate" parameter so that data points that could not be classified will be assigned a state number of "6". The plotting swf is also updated so that it plots data points with a state number of 6 in yellow.
We also updated the evaluation process so that if "0"s are seen in the resulted .Q file, we rerun the evaluation step with an extra "-addstate" parameter so that data points that could not be classified will be assigned a state number of "6". The plotting swf is also updated so that it plots data points with a state number of 6 in yellow.
Scripts for getting LLH UNAVCO data updated
The height dimension of the LLH data for the UNAVCO data source was not right, which Jay has pointed out. We updated the scripts for getting UNAVCO data so that they directly return the right data in LLH and we don't need an extra step to convert the results into LLH.
Scripts for getting UNAVCO data updated
The scripts for getting UNAVCO data in daily RDAHMM service are updated to get the data for specified starting and ending dates. They were not working correctly previously because the tools used by the scripts don't return data that exactly match the given dates. They just return the whole data set for a given station if the data set has a overlap with the given time period. Marie added a filtering step in the scripts to cut off the data that fall out of the given date range.
Deep directory structure in daily RDAHMM KMZ files are removed
The KMZ files generated by the daily RDAHMM result service used to have a deep directory structure because of the way "zip" is used. We have changed this so that the KMZ file now only contains a KML file. We also changed the file name extension from .kml.zip to .kmz so that users can directly open it with Google Earth. We plan to further change this in the future so that the KMZ will contain one top level KML and a set of sub level KMLs.
Wednesday, April 27, 2011
Disloc, Simplex, and GeoFEST Faults Corrected
We determined that the fault width values provided through the map interface to the QuakeTables fault database were incorrectly calculated. The underlying KML has been updated. This only applies to CGS 1996 and 2002 faults that were selected from the map interface, not to user-provided faults.
Tuesday, April 19, 2011
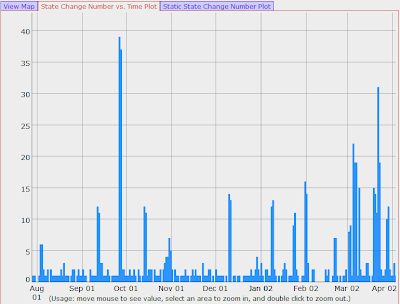
State change number plot in daily RDAHMM changed
We changed the state change number plot in daily RDAHMM portlets to use bars instead of lines, as shown in the following figure. The static png plots are also changed to use bars, and the plot for a bounded area is shown in a separate tab in stead of a new window.
For the Dygraph javascripts, we use the following options to achieve this effect:
{colors:['#007FFF'],
strokeWidth:0.7,
pixelsPerXLabel:50,
rightGap:2,
stepPlot:true,
fillGraph:true,
fillAlpha:0.8}
For the gnuplot scripts, we use the following two lines:
set style fill solid 1.0
plot "FILE" using 1:2 with boxes linetype 3
Daily RDAHMM updated to use LLH
We have changed the daily RDAHMM service and portlets so that they analyze and display LLH (longitude, latitude, height) time series data, instead of the NEU(north, east, up) data. We use the "Proj.4" application (http://trac.osgeo.org/proj/) to convert NEU data to LLH.
Monday, April 11, 2011
RDAHMM problems resolved, portal upgraded
Previously reported RDAHMM problems were resolved on March 15. Disloc, Simplex, and RDAHMM interfaces have also undergone several revisions and improvements.
Monday, January 31, 2011
RDAHMM service problems
The servers hosting the RDAHMM service are undergoing emergency maintenance, so RDAHMM is capabilities are not available.
Subscribe to:
Posts (Atom)