We updated the RDAHMM executable to correct two bugs: one that makes the binary to generate the same .maxval and .minval files when building models and the other that could lead to "0"s in the state sequence files because of overflow.
We also updated the evaluation process so that if "0"s are seen in the resulted .Q file, we rerun the evaluation step with an extra "-addstate" parameter so that data points that could not be classified will be assigned a state number of "6". The plotting swf is also updated so that it plots data points with a state number of 6 in yellow.
Monday, May 2, 2011

Scripts for getting LLH UNAVCO data updated
The height dimension of the LLH data for the UNAVCO data source was not right, which Jay has pointed out. We updated the scripts for getting UNAVCO data so that they directly return the right data in LLH and we don't need an extra step to convert the results into LLH.
Scripts for getting UNAVCO data updated
The scripts for getting UNAVCO data in daily RDAHMM service are updated to get the data for specified starting and ending dates. They were not working correctly previously because the tools used by the scripts don't return data that exactly match the given dates. They just return the whole data set for a given station if the data set has a overlap with the given time period. Marie added a filtering step in the scripts to cut off the data that fall out of the given date range.
Deep directory structure in daily RDAHMM KMZ files are removed
The KMZ files generated by the daily RDAHMM result service used to have a deep directory structure because of the way "zip" is used. We have changed this so that the KMZ file now only contains a KML file. We also changed the file name extension from .kml.zip to .kmz so that users can directly open it with Google Earth. We plan to further change this in the future so that the KMZ will contain one top level KML and a set of sub level KMLs.
Wednesday, April 27, 2011
Disloc, Simplex, and GeoFEST Faults Corrected
We determined that the fault width values provided through the map interface to the QuakeTables fault database were incorrectly calculated. The underlying KML has been updated. This only applies to CGS 1996 and 2002 faults that were selected from the map interface, not to user-provided faults.
Tuesday, April 19, 2011
State change number plot in daily RDAHMM changed
We changed the state change number plot in daily RDAHMM portlets to use bars instead of lines, as shown in the following figure. The static png plots are also changed to use bars, and the plot for a bounded area is shown in a separate tab in stead of a new window.
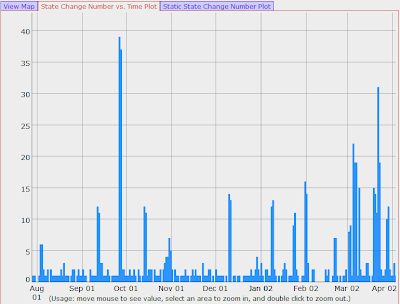
For the Dygraph javascripts, we use the following options to achieve this effect:
{colors:['#007FFF'],
strokeWidth:0.7,
pixelsPerXLabel:50,
rightGap:2,
stepPlot:true,
fillGraph:true,
fillAlpha:0.8}
For the gnuplot scripts, we use the following two lines:
set style fill solid 1.0
plot "FILE" using 1:2 with boxes linetype 3

For the Dygraph javascripts, we use the following options to achieve this effect:
{colors:['#007FFF'],
strokeWidth:0.7,
pixelsPerXLabel:50,
rightGap:2,
stepPlot:true,
fillGraph:true,
fillAlpha:0.8}
For the gnuplot scripts, we use the following two lines:
set style fill solid 1.0
plot "FILE" using 1:2 with boxes linetype 3
Daily RDAHMM updated to use LLH
We have changed the daily RDAHMM service and portlets so that they analyze and display LLH (longitude, latitude, height) time series data, instead of the NEU(north, east, up) data. We use the "Proj.4" application (http://trac.osgeo.org/proj/) to convert NEU data to LLH.
Subscribe to:
Posts (Atom)